
Blog · Gestionale
Business Intelligence Dashboards: What to Show and How to Build Them

A business intelligence dashboard is a single screen that pulls data from your systems and shows your key indicators as charts, tables and filters, so you can see how the company is doing without assembling reports by hand. For a small or medium business in Italy, the most reliable source for that data is the ERP, because it already holds sales, purchasing, stock, production and accounting. This guide explains what a good dashboard contains, gives examples for manufacturing and inventory, and covers the mistakes that turn a dashboard into a screen nobody opens.
TL;DR
- A BI dashboard shows a few KPIs on one screen, with drill-downs and filters to reach the underlying detail.
- The cleanest data source is your ERP: one version of the figures for sales, stock, production and accounting.
- Choose KPIs from your objectives, not from what the software can draw. Five to eight per role is a workable range.
- A dashboard only changes decisions if someone owns it and reviews it on a fixed rhythm.
- Manufacturers and distributors usually start with margin, on-time delivery, scrap or yield, and inventory turnover.
Table of Contents
- What a business intelligence dashboard is
- Why the ERP is the right starting point
- How to choose KPIs for your dashboard
- Examples of BI dashboards
- Is a dashboard useful for reporting?
- The obstacles Italian SMEs report
- Our perspective
- Build dashboards on your own ERP data
- FAQ
What a business intelligence dashboard is
TechTarget defines a BI dashboard as a visualization and analysis tool that shows KPIs and other important metrics on one screen. Typical components are connected data sources, charts, tables, drill-downs and filters. A common example is a sales dashboard: sales by product or by store, sales costs, and the KPIs that matter to the sales manager.
The difference from a report is practical. A report is a fixed document, produced for a date and read once. A dashboard stays connected to the data, so you can filter by customer, month or product line, and click a figure to see the orders behind it.
The same screen can serve different people if it is built per role:
- Owner or general manager: revenue, gross margin, cash position, order backlog.
- Sales manager: orders by customer and agent, quote conversion, margin by product line.
- Production manager: output against plan, scrap, machine downtime, delays.
- Purchasing and warehouse: stock levels, turnover, slow-moving items, supplier lead times.
- Accountant or CFO: receivables ageing, payables, budget against actual.
Why the ERP is the right starting point
Most small and medium companies do not lack data. They have it spread across spreadsheets, a website, an accounting program and someone’s memory. A dashboard built on top of that mix inherits its contradictions: two people open two files and read two different revenue figures.
An ERP records each transaction once, at the moment it happens. An invoice posted in accounting is the same invoice that sales sees, and a stock movement in the warehouse is the same one purchasing sees. When a BI layer reads from that single source, the dashboard and the ledger agree. This is the main reason we recommend building BI on the ERP rather than next to it. If you want the architecture in more detail, our guide to integrating business intelligence and ERP covers it, and custom ERP dashboards looks at the CFO and management view.
There are three common ways to connect them:
- BI module inside the ERP. The analysis tool is part of the same product family, with ready-made views and access rights inherited from the ERP. It is the fastest to start and the simplest to maintain.
- General-purpose BI tool reading ERP data. Useful when you need to combine the ERP with other sources, such as your online store or a CRM. See how this works in practice in our article on connecting Power BI to an ERP.
- Spreadsheet exports. Acceptable for a first test, but it brings back manual work and version problems, and it rarely survives a year.
For companies on il gestionale Passepartout Mexal or il gestionale Passcom, PassBI is the business intelligence option built for those ERPs.
How to choose KPIs for your dashboard
The most common failure is a screen with thirty charts. AgID, the Italian digital agency, recommends in its web analytics guidelines that KPIs be selected from specific objectives and then monitored and optimized continuously, with monitoring that can be real-time, periodic or comparative. The same document explains that KPI monitoring shows progress toward predefined goals, flags underperforming areas that need corrective action, and gives objective evidence for allocating resources. The guidance is written for public websites, but the logic applies to any company.
A practical method:
- Write the decision first. “Should we reorder this item?” “Which customers are eroding our margin?” A KPI that supports no decision does not go on the screen.
- Pick one to three indicators per decision. Fewer is better.
- Define each formula in writing. Does revenue include credit notes? Does margin use standard or actual cost? Disagreements here cause most dashboard distrust.
- Fix the review rhythm. Daily for operations, weekly for sales, monthly for management and finance.
- Name an owner for each indicator, who answers when it moves.
Our article on which ERP KPIs to monitor and how often goes through this by company function. If you also track your website as part of the same picture, the same principle of tying metrics to objectives is covered in this guide on measuring website success with KPIs.
Examples of BI dashboards
Sales dashboard
The typical sales view shows revenue against target, sales by product family, customer and agent, quote-to-order conversion, and gross margin. Drill-downs let the manager click a falling product line and see which customers stopped ordering. For companies that sell online and in person, adding e-commerce orders to the same screen gives one revenue figure instead of two.
Manufacturing KPI dashboard
Production dashboards compare plan with actual and make losses visible. The OpsDog manufacturing KPI catalogue lists measures such as first-pass yield, overall equipment effectiveness, machine uptime, production attainment, capacity utilization, setup time and scrap rate, along with separate turnover figures for finished goods, raw materials and work in process. You do not need all of them. A mid-sized workshop might start with these:
| KPI | What it tells you | Typical ERP or il nostro MES per la produzione source |
|---|---|---|
| Production attainment | Units made against the plan | Production orders |
| Scrap rate | Material and time lost to defects | Production declarations |
| Machine uptime | Availability of critical equipment | MES or machine data |
| Setup time | Time lost in changeovers | MES or routing data |
| On-time delivery | Orders shipped by the promised date | Sales orders and shipping |
| Raw material turnover | How fast purchased material is used | Warehouse movements |
An Italian example is documented in a University of Bologna case study on IRIS Ceramica Group. It reports that combining traditional management systems with business analytics improved information quality and decision-making. The project built production dashboards and KPIs and automatically analyzed recurring patterns in unproductive furnace time.
Machine-level indicators depend on reliable shop-floor data. Our guide to shop floor data collection explains how machines feed the ERP, and the article on production KPIs with MES and BI shows how the two layers fit together.
Inventory turnover dashboard
Stock ties up cash, so many companies start here. Inventory turnover is calculated by dividing cost of goods sold by average inventory for the same period, as Wall Street Prep explains. A higher figure means stock is converted to sales faster.
A useful inventory dashboard shows:
- Turnover by product family, not only for the company as a whole, because an average hides both fast and dead items.
- Days of stock on hand for the top items by value.
- Slow-moving and obsolete items, with the value tied up in them.
- Stock-outs and the orders lost or delayed because of them.
- Supplier lead time against what was promised.
A worked example with invented numbers, only to show the arithmetic: if a distributor has cost of goods sold of 1,200,000 € in a year and average inventory of 300,000 €, turnover is 4. That means stock is sold and replaced four times a year, or roughly every 90 days. If one product family turns twice a year while another turns eight times, the dashboard tells you where to cut purchasing and where to raise safety stock. A good turnover figure depends on the sector, so compare against your own history and your own product families first. Our pages on warehouse and stock management software go deeper on the operational side.
Finance dashboard
Receivables ageing, payables due, cash flow forecast and budget against actual. For accountants who manage several clients, the useful feature is a consolidated view across companies, with the same indicators for each.
Is a dashboard useful for reporting?
Yes, with a condition. For routine internal reporting it replaces the monthly spreadsheet with a live view, and it cuts the time spent collecting and reconciling figures. For formal reporting, such as financial statements or tax filings, the dashboard is a way to monitor and query, while the official figures still come from the accounting records.
The condition is organizational. A 2026 University of Milan study found that a digital performance dashboard has substantial informational potential, but its effect on managerial decisions depends on sustained leadership commitment, a clear change agenda, alignment between strategic and operational levels, and a supportive culture. Visibility alone does not change how a company is run. If your team sees the dashboard as surveillance, or if nobody reviews it, the screen becomes decoration.
Three habits help:
- Open the dashboard in the weekly meeting, not as a separate task.
- Let each department help define its own indicators.
- Remove any chart nobody has used in a quarter.
Our guide to ERP change management covers how to get a team to adopt a new tool.
The obstacles Italian SMEs report
The 2024 Mediobanca Research and Unioncamere report on medium-sized enterprises shows that digitalization is already widespread: 84.9% of Italian medium-sized enterprises had invested in process digitalization, 57.2% in advanced management systems or additive manufacturing, and 45.9% in warehouse and logistics optimization. The same report found that 42.7% named a lack of competent personnel as the main obstacle to innovation, and 23.6% cited high and uncertain costs.
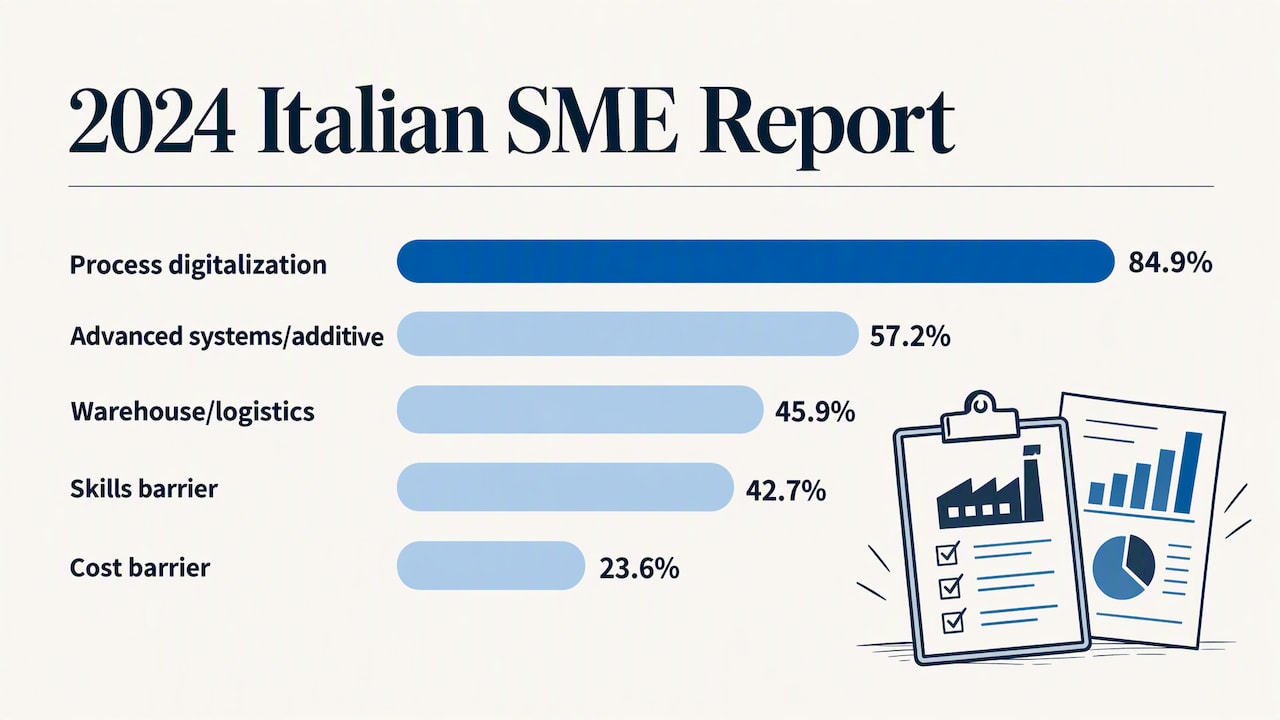
For a dashboard project, those two obstacles are the real planning issues. Skills: choose a tool your own staff can read and adjust, and plan training. Cost: start with one function, such as sales or stock, prove its value and then extend.
Our perspective
In our experience, a dashboard project fails for one of two reasons: the data underneath is not trusted, or nobody owns the indicators. The software is rarely the problem.
That is why we begin with the ERP configuration, not with charts. If product codes, price lists, cost centers and stock locations are consistent, a dashboard can be built quickly and the numbers hold up. If they are not, the first step is to clean them, and a dashboard will expose exactly where the problems are.
We also keep the number of indicators low. Each client has a dedicated consultant who learns how the company works, so the first dashboard reflects the questions the owner or the production manager actually asks, not a template. We usually suggest launching one dashboard per role, reviewing it with the users after a month, and only then adding more.
Finally, we separate what the dashboard monitors from what the accountant signs. Both come from the same ERP, which is why they agree.
— Claudio
Build dashboards on your own ERP data
LINKWARE configures ERP software around your processes, including Passepartout solutions, and supports the business intelligence and dashboard layer on top of them, with the same consultant following your company from analysis to use. If you want to see what your own sales, stock or production figures would look like on one screen, contact us to request a demo, or see the full range of solutions on the LINKWARE homepage.
FAQ
What is a business intelligence dashboard, with an example?
It is a single-screen tool that shows KPIs and other key metrics from connected data sources, with charts, tables, filters and drill-downs. A sales dashboard is the classic example: it shows sales by product or store, sales costs and related indicators, and lets you click through to individual orders.
How does a BI dashboard use ERP data?
The BI layer reads the ERP database or its exports on a schedule or in near real time, then organizes the data into indicators. Because the ERP records each transaction once, the dashboard figures match accounting, sales and warehouse records. Access rights can follow the ERP roles, so each person sees only what they should.
Which KPIs should a manufacturing dashboard show?
Start with production attainment, scrap rate, machine uptime, on-time delivery and raw material or finished goods turnover. Add first-pass yield or overall equipment effectiveness once your machine data is reliable. Pick the ones tied to a decision your production manager makes every week.
How does an inventory turnover dashboard help?
It shows how fast each product family is sold and replaced, calculated as cost of goods sold divided by average inventory. You see slow-moving stock and cash tied up in it, and the items at risk of running out. That lets purchasing reduce overstock while protecting the fast sellers.
Do we need a separate BI tool, or is the ERP enough?
If your data lives mostly in the ERP, a BI module built for that ERP is often enough and is the quickest to maintain. A separate tool makes sense when you need to combine the ERP with other sources, such as an online store or a CRM. A consultant can compare both options against your actual reporting needs.
Recommended
Vuoi digitalizzare la tua azienda?
Un consulente LINKWARE ti propone la soluzione su misura, senza impegno.
Richiedi una demo gratuita