
Blog · Gestionale
Sales Dashboard KPIs: What to Track and How to Build It

A good sales dashboard shows six to ten KPIs that answer one question: are we on track to hit our revenue target, and if not, where is the gap? For most small and medium businesses that means revenue against target, pipeline coverage, win rate, average order or deal value, sales cycle length, margin and customer retention. The harder part is not choosing the KPIs. It is making sure the numbers come from one reliable source, so nobody argues about them in the Monday meeting.
This guide lists the KPIs worth putting on a sales dashboard, gives the formula for each, shows how to lay them out, and explains when a free Excel file is enough and when it is time to feed the dashboard directly from your ERP.
TL;DR
- Start with 6 to 10 KPIs, each tied to a target and a decision: revenue vs target, pipeline coverage, win rate, average order value, sales cycle, gross margin and repeat customers.
- Define every KPI in writing (formula, source field, period) before you draw a single chart.
- An Excel template is a fair starting point for one team and a few hundred rows of data. It breaks down when several people re-type the same figures.
- When orders, invoices and stock already live in your ERP, the dashboard should read from the ERP, not from copies of it.
- Review the dashboard on a fixed rhythm: weekly for pipeline and activity, monthly for margin and retention.
Table of Contents
- What a sales dashboard is for
- The sales KPIs that belong on the dashboard
- A quick reference table
- How to choose and define your KPIs
- Layout: how to arrange the page
- Starting with Excel: when it is enough
- From spreadsheet to live dashboard
- A worked example
- Common mistakes to avoid
- Our perspective: the dashboard is only as good as the process behind it
- How Linkware can help
- FAQ
What a sales dashboard is for
A sales dashboard is a single page that turns sales data into a handful of indicators, compared with a target or a previous period. It is not a report with every number you own. Its job is to let a manager see in under a minute whether something needs attention.
Two mistakes recur in SMEs. The first is building the dashboard around the data that happens to be available rather than around the questions the owner actually asks. A dashboard that “puts everything on the page” becomes unreadable; a useful one answers three or four questions the business owner asks every week, as this analysis of company dashboards also points out. The second is showing a number with no target next to it. Revenue of 84,000 € means nothing until you know the goal was 100,000 €.
A practical way to start: write down the five questions you ask your sales team most often. Each question should map to one KPI.
The sales KPIs that belong on the dashboard
The list below groups KPIs by the question they answer. You will not need all of them. Pick the ones that match how you sell.
Results: are we hitting the number?
Revenue vs target. Invoiced or ordered revenue in the period, shown against the budget for the same period. Decide once whether you count orders confirmed or invoices issued, and stick to it. Show it as a progress bar and as a cumulative line across the month or year.
Sales growth. Revenue this period minus revenue in the same period last year, divided by last year’s revenue. Compare with the same month of the prior year, not the previous month, if your business is seasonal.
Gross margin. (Revenue minus direct cost of goods or services) divided by revenue. Revenue can rise while margin falls, especially when discounts are used to close deals. If your ERP holds product costs, this is one of the most valuable numbers you can add.
Pipeline: will we hit it next month?
Open pipeline value. The total value of open quotes or opportunities, split by stage. Weight it by probability only if you have enough history to trust the percentages.
Pipeline coverage. Open pipeline value divided by the revenue still to be closed in the period. A common rule of thumb is to hold three times the target, but the right multiple depends on your own win rate: the lower it is, the more coverage you need. Work out your own figure from your history.
Quote-to-order conversion (win rate). Orders won divided by quotes decided, whether won or lost. Be explicit about the denominator. If you divide by every quote ever sent, including ones still open, the figure is artificially low.
Efficiency: how well do we sell?
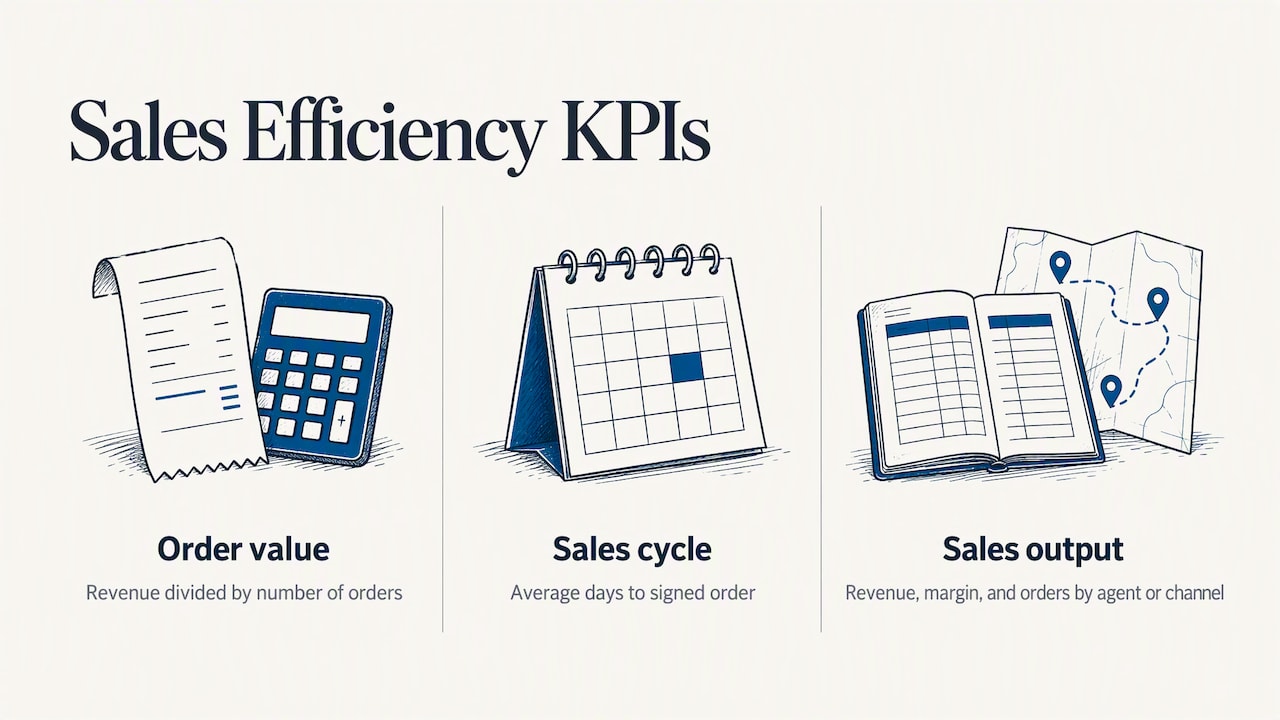
Average order value or average deal size. Revenue divided by number of orders. In a B2B business it is more useful when split by customer segment or sales agent.
Sales cycle length. Average number of days between first contact or quote and signed order. A rising number is an early warning that deals are stalling.
Sales per agent or per channel. Revenue, margin and number of orders by salesperson, agent, branch or channel (direct, e-commerce, marketplace). This is where a dashboard starts to drive coaching and planning.
Customers and products: where does the money come from?
Top customers and top products. The top five of each, with their share of total revenue. If one customer is 35% of sales, you want that on the screen, not discovered at year end.
Repeat customer rate. Customers with more than one order in the period divided by all customers who ordered. For recurring-contract businesses, add churn: customers lost divided by customers at the start of the period.
Product mix. Revenue and margin by product family. It shows which lines pay for the rest.
Extra KPIs for e-commerce
If you sell online, add three indicators from the shop itself: conversion rate (orders divided by sessions), cart abandonment rate and average order value by channel. The most useful step is to see them next to the same customers’ offline purchases, which requires the shop and the ERP to exchange data. We cover that connection further down.
A quick reference table
| KPI | Formula | Where the data lives | Review |
|---|---|---|---|
| Revenue vs target | Revenue in period / target for period | Invoices or orders in the ERP | Weekly |
| Gross margin | (Revenue – direct costs) / revenue | ERP, product costs | Monthly |
| Pipeline coverage | Open pipeline / revenue still to close | CRM or quotes | Weekly |
| Win rate | Orders won / quotes decided | Quotes and orders | Monthly |
| Average order value | Revenue / number of orders | Orders | Monthly |
| Sales cycle | Average days from quote to order | Quotes and orders | Monthly |
| Repeat customer rate | Customers with 2+ orders / customers ordering | Customer master and orders | Quarterly |
How to choose and define your KPIs
Before building anything, write a one-line definition card for each KPI:
- Name and purpose: which decision does it support?
- Formula: numerator, denominator, exclusions (credit notes, samples, intercompany sales).
- Source: which system and which field. If two sources disagree, decide which one wins.
- Period and comparison: month to date, rolling 12 months, versus budget or versus last year.
- Owner: the person who explains the number when it moves.
- Target and thresholds: what is green, amber and red.
This takes an afternoon and prevents most disputes later. For a deeper treatment of frequency and ownership, see our guide to business KPIs in an ERP and how often to monitor them. If you are also looking at the operational side of the company, the operational performance metrics a team tracks follow the same logic: few indicators, clear definitions, a named owner.
Layout: how to arrange the page
The dashboards that get used follow a simple reading order:
- Top row: three to five headline numbers (revenue vs target, margin, pipeline coverage, win rate) with the comparison and a colored status.
- Middle: trends over time. A monthly revenue line against budget and a bar chart by channel or agent.
- Bottom: detail for action. Top customers, top products, quotes older than 30 days, orders not yet shipped.
A few rules keep it readable. Use one chart type per question, show the target on every chart, limit colors to status, and put filters (period, agent, branch, product family) in one fixed place. If a number is never used in a meeting, remove it.
Starting with Excel: when it is enough
For a small team, a spreadsheet is a legitimate first step. Free Italian-language templates exist with euro currency and dd/mm/yyyy dates; one example, a sales target management template, offers a clean dashboard with essential KPIs and sheets for salespeople, products and monthly trend. A sales management template from the same publisher shows charts by product, by customer and over time. Microsoft also publishes free Excel templates in Italian and a dashboard builder that turns existing data into charts and tables.
Excel works well when:
- one person owns the file and enters the data;
- you have a few hundred or a few thousand rows a year;
- you only need revenue, top customers and target comparison;
- nobody needs the numbers in real time.
It starts to cost you when:
- sales data is exported from the ERP, pasted into the file and then corrected by hand, so two people hold two versions of the truth;
- e-commerce orders, shop invoices and showroom sales are in different files;
- you need margin by product, which requires costs that live in the ERP;
- the file is emailed around and nobody knows which copy is current;
- a formula breaks quietly and no one notices for a quarter.
A useful test: if you spend more than an hour a week preparing the numbers before you can discuss them, the dashboard is costing more than it saves.
From spreadsheet to live dashboard
The step after Excel is not another file. It is a dashboard that reads directly from the system where orders and invoices are already recorded. That removes re-typing and gives everyone the same figures at the same time.
There are three typical routes:
- Dashboards inside the ERP. The simplest option when your management system already has reporting and configurable indicators. Data is always current and users see it with the permissions they already have. Our guide to custom ERP dashboards for CFOs and managers explains how to design them.
- A business intelligence layer on top of the ERP. Useful when you want to combine sources, for example ERP, CRM and web analytics, or when you need heavier analysis. See how to connect Power BI to an ERP and how business intelligence and ERP fit together.
- A CRM for the pipeline. Pipeline stages, activities and forecasts are best recorded in a CRM, then reconciled with orders and invoices from the ERP. We explain the link with marketing in integrating CRM and marketing to close more contracts.
Whichever you choose, three conditions decide whether the dashboard can be trusted:
- One customer and product master. The same customer must have the same code in the quote, the order and the invoice.
- Consistent status definitions. “Won”, “shipped” and “invoiced” must mean the same thing in every report.
- Clean e-commerce integration. If your web shop and ERP are not connected, online sales will be missing or duplicated. Our guides on integrating marketplaces with an ERP and on e-commerce and SdI invoicing without rejections cover the practical points for Italian businesses.
A worked example
Take a distributor with 12 agents and a web shop. The owner wants to know on the 20th of each month whether the month will close on target. The dashboard shows:
- revenue to date against the monthly budget, with the projected close;
- open quotes by agent, with those older than 30 days highlighted;
- win rate by agent over the last 90 days;
- gross margin by product family;
- online share of orders and average order value for the shop.
The reading is straightforward. If revenue is at 70% of target on the 20th and pipeline coverage for the remaining days is low, the owner calls the agents with the oldest open quotes. If margin on one product family drops while revenue holds, discounts are the first place to look. None of this needs a complicated tool. It needs the numbers to come from the same place every time.
Common mistakes to avoid
- Too many KPIs. Past ten, the page stops being read.
- Vanity metrics. Number of calls or visits without a link to orders tells you about activity, not results.
- No targets. Without a comparison, every number looks fine.
- Mixing definitions. Revenue by order date in one chart and by invoice date in another produces permanent confusion.
- Ignoring data quality. A missing agent code or a duplicate customer distorts every chart that uses it.
- Never revisiting the dashboard. Every quarter, remove one KPI nobody used and add one a decision needed.
Our perspective: the dashboard is only as good as the process behind it
In our experience, companies rarely fail at dashboards because of the charts. They fail because the underlying process is not defined. Quotes are sometimes entered and sometimes not. Agents use their own spreadsheets. The web shop sends orders by email. Then the dashboard shows a number everyone distrusts, and people go back to their own files.
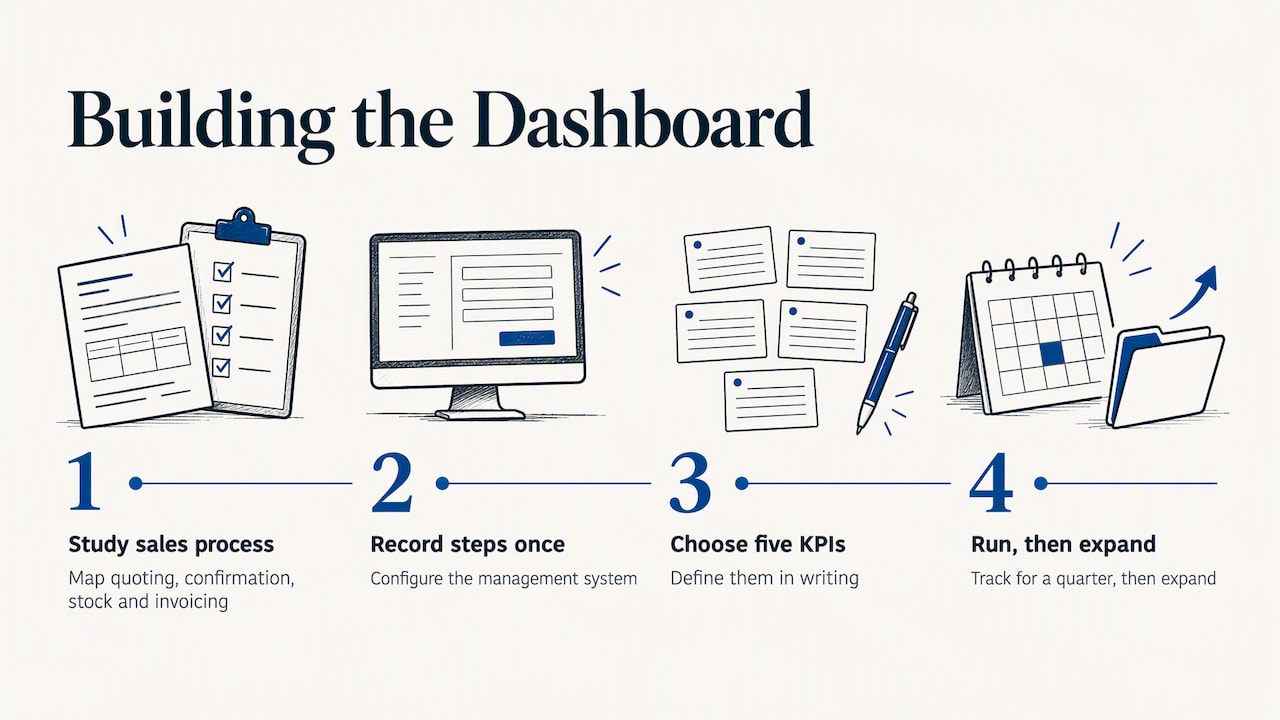
We approach it in the opposite order. First we study how the company actually sells: who quotes, who confirms, where stock and invoicing are updated. Then we configure the management system so that these steps are recorded once. Only after that do we decide which indicators the owner and the sales manager need, and build them on top of that data. A dedicated consultant follows each client rather than a call center, because defining a KPI properly means knowing the business behind it.
Our advice is to start small. Choose five KPIs, define them in writing, run them for a quarter, then expand. If your data already sits in an ERP, do not rebuild it in Excel: connect to it.
— Claudio
How Linkware can help
We configure management software around the way your company works, including sales dashboards, agent apps, CRM and the integration between ERP and your l'integrazione con WooCommerce or PrestaShop shop, so sales KPIs come from one set of data. If you want to see what your own dashboard could look like, talk to us about a tailored management system and request a demo built on your processes. If you sell online, take a look at our e-commerce services.
FAQ
What are the most important KPIs for a sales dashboard?
The core set is revenue against target, pipeline coverage, win rate, average order value, sales cycle length and gross margin. Add repeat customer rate if you rely on returning buyers. Five to eight indicators are usually enough for a first version.
Where can I find a free Excel sales dashboard template?
Microsoft publishes free Excel templates in Italian, and specialized sites offer sales and target-tracking models with a ready dashboard. They suit a single team and simple needs. When several people maintain the data or you need margin by product, connect the dashboard to your ERP instead.
How often should I review sales KPIs?
Review pipeline, activity and revenue against target weekly, since these let you act before the month closes. Review margin, win rate and sales cycle monthly, and customer retention quarterly. Fix the day and the owner so the review actually happens.
What is the difference between a sales dashboard and a sales report?
A dashboard is a one-page, regularly updated view of a few indicators against targets, built to prompt action. A report is a detailed document for a period, used for analysis or record keeping. Most businesses need both, with the dashboard pointing to the report when something looks wrong.
When should I move from Excel to an ERP-based dashboard?
Move when preparing the numbers takes more than about an hour a week, when sales come from several channels, or when people hold different versions of the same file. At that point a dashboard that reads from the ERP saves time and removes disputes about which figure is right.
Recommended
Vuoi digitalizzare la tua azienda?
Un consulente LINKWARE ti propone la soluzione su misura, senza impegno.
Richiedi una demo gratuita